プロットされたデータの色を決定するために、
説明
この配列の内容は自由に変更できます。代わりに、Chart.color-palette を設定することにより、独自の配列を提供できます。この目的のため、代替配列が提供されています。pastel-chart-color-palette を参照してください。
この配列を変更すると、パッケージ内で default-chart-color-palette を使用するすべての Chart に影響します。影響を受ける Shape を再生成できるようにするため、このパレットを使用して、すべての Chart で Chart.note-color-palette-changed を呼び出す必要があります。
詳細については、Chart.color-palette を参照してください。
例
| 例: default-chart-color-palette の変更および複数の Chart の更新 | |
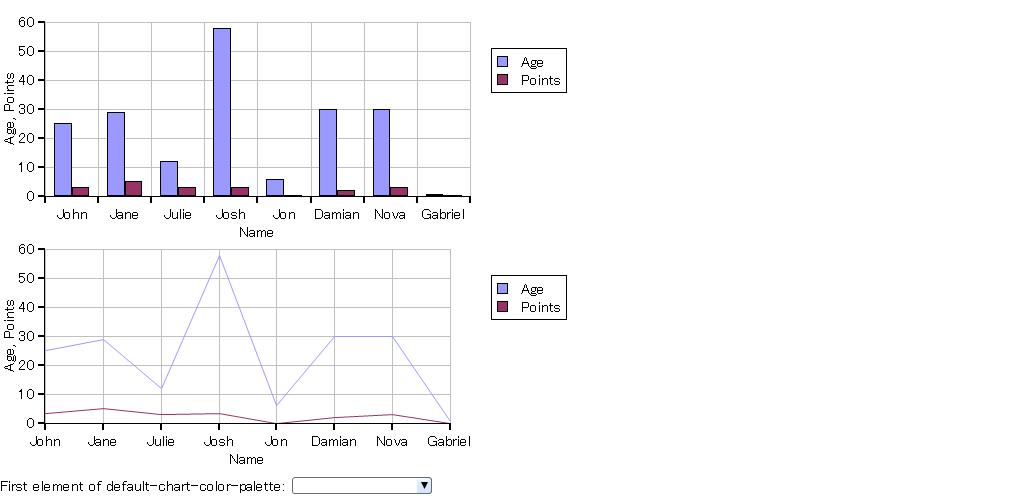 | |
{import * from CURL.GUI.CHARTS}
{import * from CHARTS-DOC,
    location = "../docstring-support/gui/charts-doc.scurl"
}

{let chart-a:Chart =
    {LayeredChart
        width = 15cm,
        height = 6cm,
        {BarLayer
            sample-records,
            "Age",
            "Points",
            x-axis-data = {ChartDataSeries sample-records, "Name"}
        }
    }
}

{let chart-b:Chart =
    {LayeredChart
        width = 15cm,
        height = 6cm,
        {LineLayer
            sample-records,
            "Age",
            "Points",
            x-axis-data = {ChartDataSeries sample-records, "Name"}
        }
    }
}

{value chart-a}
{value chart-b}

First element of default-chart-color-palette:
{DropdownList
    "black", "blue", "turquoise", "purple", "crimson",
    list-item-creation-proc =
        {proc {val:any}:ListItem
            {return
                {ListValueItem
                    value=val,
                    {RectangleGraphic fill-color=val,
                        width=50pt, height=10pt
                    }
                }
            }
        },
    {on ValueChanged at ddl:DropdownList do
        set default-chart-color-palette[0] = ddl.value asa FillPattern
        {chart-a.note-color-palette-changed}
        {chart-b.note-color-palette-changed}
    }
}
|