このパッケージは、Curl® データ アクセス パッケージでの操作用に設計された、柔軟なグラフ作成システムを提供します。開始するにあたっては、
例
| 例 | |
 | |
{import * from CURL.GUI.CHARTS}
{import * from CHARTS-DOC,
location = "../docstring-support/gui/charts-doc.scurl"
}
{define-proc package {h-gradient
start-color:FillPattern,
highlight-color:FillPattern,
end-color:FillPattern,
highlight-pos:double = 0.2
}:FillPattern
{return
{LinearGradientFillPattern
{Fraction2d 0, 0},
{Fraction2d 1, 0},
{Spectrum.from-envelope
start-color,
0.0,
highlight-color,
highlight-pos,
end-color,
1.0
}
}
}
}
{ShapeBox
border-width = 3pt,
border-style = "sunken",
background = "silver",
width = 15cm,
height = 8cm,
{LayeredChart
plot-area =
{LayeredPlotArea plot-background = "white"},
color-palette =
{new {Array-of FillPattern},
{h-gradient "gray", "white", "gray"},
{h-gradient "blue", "lavender", "steelblue"},
{h-gradient "red", "mistyrose", "crimson"},
{h-gradient "purple", "lavender", "blueviolet"},
{h-gradient "lime", "mintcream", "green"}
},
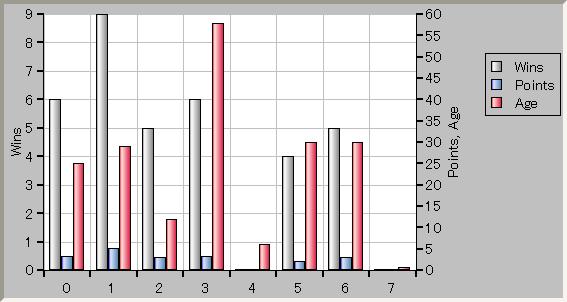
{BarLayer
sample-records,
"Wins",
"Points",
"Age"
}
}
}
|