Caede2.0.0で追加されたリストビューア、チャート、シェイプのサンプルをご紹介します。
リストビューア
Caede2.0.0ではリストビューア(ListViewer)が実装されました。
これをもちましてリストビュー(ListView)は非推奨となり、Caede2.1.0にて廃止されました。
|
|| ListViewerクラス (フレームワークのGraphicクラスに定義) {ListViewer || 以下はScreenクラスに記述します def list-viewer = {self.find-graphic-by-name “sample-list-viewer”} asa ListViewer || list-item-creation-proc オプションを定義します。 set list-viewer.list-item-creation-proc = || data-modelオプションを定義します。 def connected-list-model = {ConnectedListModel} |
以上のコーディングで以下のような動作が実現できます。
起動時。10件が読み込まれています。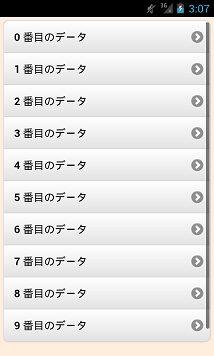
末尾で上に向けてフリックすると、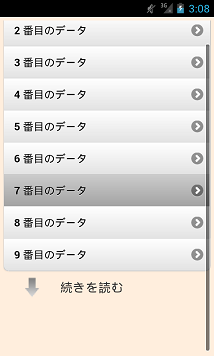
追加で10件が読み込まれます。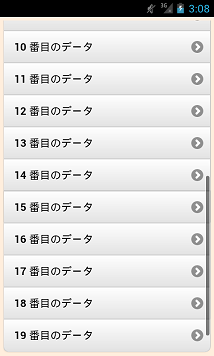
チャート
|
|| 使用するデータとして以下のRecordSetを用意します。 def record-set:RecordSet = || BarLayerを使用して棒グラフを表示します。 let chart-box:ChartBox = |
以上のコーディングでこのような棒グラフが表示できます。

BarLayerの代わりにLineLiyerとすると、同じデータから折れ線グラフが表示できます。

シェイプ
Curlと同様にShapeが使用できます。
| def canvas = {Canvas background = “aqua”} {canvas.add {ShapeGroup || 四角形 {RectangleShape {GRect 0in, 1in, 0in, 0.6in}, color = “pink”, border-color = “brown”, border-width = 3px }, || 四角形(境界が点線) {RectangleShape {GRect 0.5in, 0.6in, 0in, .2in}, translation = {Distance2d 0.6in, 0.3in}, color = “transparent, border-color = “brown”, border-width = 1px, border-line-style = “dot” }, || 文字 {TextShape “RectangleShape”, translation = {Distance2d 0.6in, 0.3in}, color = “brown”, valign = “top”, halign = “center“ }, translation = {Distance2d 0.3in, 1.4in} } } {canvas.add {ShapeGroup || 円 {EllipseShape {GRect .5in, .5in, .5in, .5in}, border-width = 2px, border-color = “brown”, color = “skyblue”, translation = {Distance2d .6in, .6in} }, || 扇形 {EllipseShape {GRect .5in, .5in, .5in, .5in}, border-width = 2px, border-color = “brown”, color = “orange”, start-angle = 45deg, stop-angle = 120deg, wedge? = false, translation = {Distance2d .6in, .6in} }, || 文字(60度傾斜) {TextShape “EllipseShape”, translation = {Distance2d .5in, .5in}, color = “brown”, rotation = -60deg, valign = “top”, halign = “center” } } } |
上記のコードで以下のような画面を表示できます
