線を使用してデータ系列をプロットする
説明
既定では、LineLayer は、PathShape を LineLayer.y-axis-data の各メンバごとに生成します。生成された Shape は LineLayer.series-shapes で見つかります。
Shape の外観と動作はいくつかの方法でカスタマイズできます。最も簡単な方法はオプションを使用することです。他のグラフ コンポーネントの場合と同様、Shape は、それがある場所またはその上のどこにでも非ローカル オプション セットを使用して制御することができます。たとえば、stroke-thickness を設定して、PathShapes の厚さを変更できます。
また、LineLayer.shape-factory を使用すれば、Shape の作成プロセスをオーバーライドすることもできます。これは非常に用途の広い手法です。これを使用すれば、個々の Shape のオプション値を変更したり、Shape の Tooltip を提供したり、まったく種類の異なる Shape を一緒に生成したりさえできます。
注意事項
グラフへのその他のオブジェクトの追加については、ChartLayer を参照してください。
例
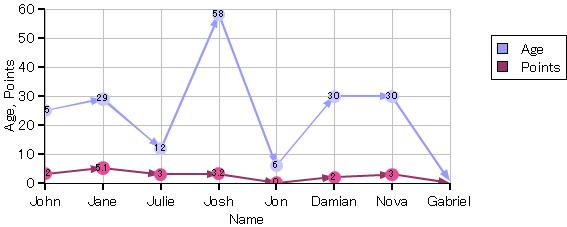
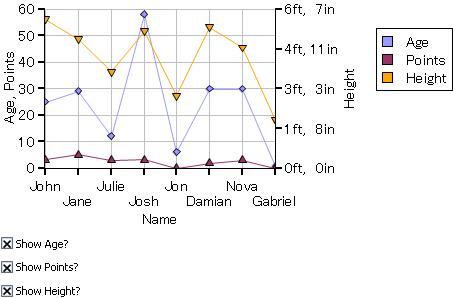
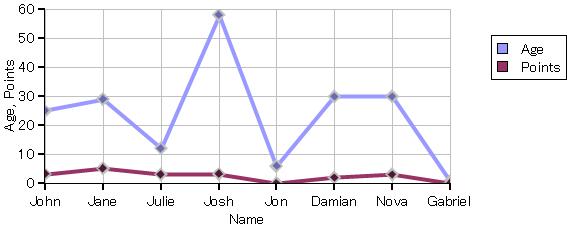
この例では、LineLayer レベルでの非ローカル オプションの使用法を示すとともに、追加の Shape を作成するための LineLayer.shape-factory の高度な使用法をヒント付きで示しています。
| 例 | |
 | |
{import * from CURL.GUI.CHARTS}
{import * from CHARTS-DOC,
    location = "../docstring-support/gui/charts-doc.scurl"
}

{let chart:LayeredChart =
    {LayeredChart
        width = 15cm,
        height = 6cm,
        {LineLayer
            sample-records,
            "Age",
            "Points",
            x-axis-data = {ChartDataSeries sample-records, "Name"},
            stroke-thickness = 3pt,
            shape-factory =
                {proc
                    {layer:LineLayer,
                     points:{FastArray-of PointRecordPair},
                     series-index:int
                    }:Shape

                    let constant stock-shape:Shape =
                        {LineLayer.default-shape-factory
                            layer,
                            points,
                            series-index
                        }
                    let constant fill-pattern:FillPattern =
                        {layer.get-fill-pattern-for-data-series series-index}

                    {for point in points do
                        {stock-shape.add
                            {RectangleShape
                                {GRect 3pt, 3pt, 3pt, 3pt},
                                translation = point.point,
                                rotation = 45deg,
                                color = {darker-fill-pattern fill-pattern},
                                border-width = 1.5pt,
                                border-color = FillPattern.silver,
                                tooltip =
                                    {Tooltip
                                        style = TooltipStyle.immediate,
                                        {value
                                            def fname =
                                                layer.y-axis-data[series-index].field.name
                                            {format "%s: %s = %g",
                                                point.record["Name"],
                                                fname,
                                                point.record[fname]
                                            }
                                        }
                                    }
                            }
                        }
                    }
                    {return stock-shape}
                }
        }
    }
}

{AntialiasedFrame chart}
|