明示的な範囲に基づく
説明
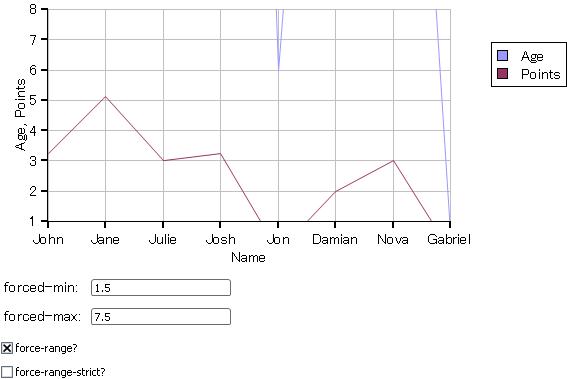
ほとんどの軸タイプとは対象的に、このクラスはその基礎としてデータを使用しません。代わりに、t によって指定された Type および作成時に (または NumericAxis-of.set-range を介して) 明示的に指定された範囲を使用します。
注意事項
例
| 例: NumericAxis-of を使用しての固定範囲軸の指定 | |
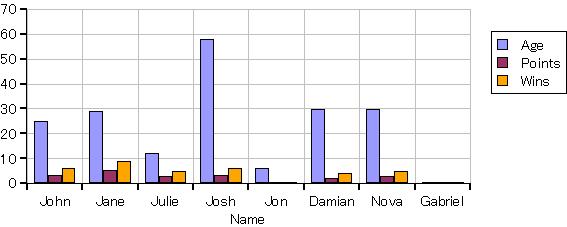 | |
{import * from CURL.GUI.CHARTS}
{import * from CHARTS-DOC,
    location = "../docstring-support/gui/charts-doc.scurl"
}

{LayeredChart
    width = 15cm,
    height = 6cm,
    left-axis = {new {NumericAxis-of double}, 0, 70},
    {BarLayer
        {ChartDataSeries sample-records, "Age"},
        {ChartDataSeries sample-records, "Points"},
        {ChartDataSeries sample-records, "Wins"},
        x-axis-data = {ChartDataSeries sample-records, "Name"}
    }
}
|