{NumericDataSeriesAxis-of t:NumericType} (クラス)
public NumericDataSeriesAxis-of {inherits {NumericAxisMixin-of t}, DataSeriesAxis}
パッケージ: CURL.GUI.CHARTS

DataSeriesAxis の数値実装。

説明

これは、最も一般的に使用されるタイプの軸です。この場合、その範囲が値 DataSeriesAxis.minimumDataSeriesAxis.maximum に基づいて選択されます。これらの値は、DataSeriesAxis.data から計算されたものです。
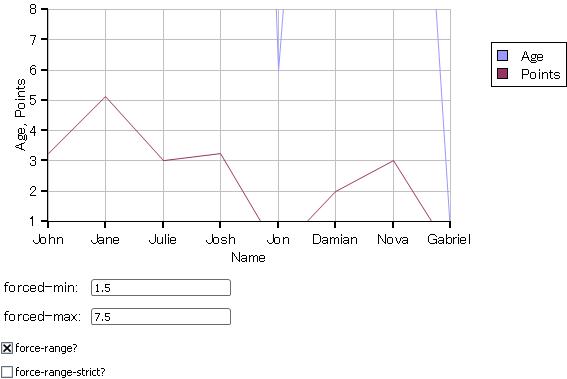
この表示される軸の境界は、サブクラスを作成して、NumericDataSeriesAxis-of.generate-major-ticksNumericAxisMixin-of.calculate-tick-spacing などのメソッドをオーバーライドする他、NumericAxisMixin-of.set-forced-rangeNumericAxisMixin-of.visible-values、および tick-spacing-proc を使用して変更できます。
強制範囲、目に見える値パラメータ、および tick-spacing-proc を、NumericDataSeriesAxis-of.default コンストラクタによっても設定できることに注意してください。

注意事項

このタイプの軸は、自動的に作成されることがよくあります。各軸でグループ化される ChartDataSeries を厳密に制御する必要がある場合、あるいは前に説明したいずれかの手法を用いて軸の範囲を変更したい場合は、独自のものを作成できます。また、軸を手動で作成して、Shape コンテナ (ChartAxis.major-tick-group など) の 1 つを明示的に提供することができます。これにより、グループに関してオプションを設定できます。たとえば、ChartAxis.major-tick-groupShape.color を設定すると、すべての主目盛りの色が変更されます。
軸の自動作成および軸をプロットされたデータに関連付けるプロセスの詳細については、LayeredChart を参照してください。

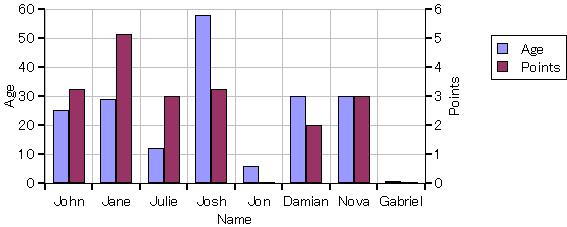
この例では、左軸と右軸を手動で作成し、「Name」と「Points」のデータが個別にプロットされるようにします。このステップを踏まないと、これらが 1 つの軸に一緒にグループ化されます。軸を手動で作成する代わりに、軸を 2 つの異なる ChartLayer に配置し、LayeredChart.group-y-axis-data-across-layers? がその既定値の false に設定されるようにすることもできます。これにより、自動軸生成プロセスが同様に実行されるようになります。ただし、すべての構成がこのように実現できるとは限りません。

例: 手動で NumericDataSeriesAxis-of を作成してのデータ グループ化の制御
{import * from CURL.GUI.CHARTS}
{import * from CHARTS-DOC,
    location = "../docstring-support/gui/charts-doc.scurl"
}

{LayeredChart
    width = 15cm,
    height = 6cm,
    left-axis =
        {new {NumericDataSeriesAxis-of double},
            {ChartDataSeries sample-records, "Age"}
        },
    right-axis =
        {new {NumericDataSeriesAxis-of double},
            {ChartDataSeries sample-records, "Points"}
        },
    {BarLayer
        sample-records,
        "Age",
        "Points",
        x-axis-data = {ChartDataSeries sample-records, "Name"}
    }
}

コンストラクタ
default:新しい NumericDataSeriesAxis-of オブジェクトを作成します。
コンストラクタ public {NumericDataSeriesAxis-of.default
force-zero?:bool = true,
force-range?:bool = false,
force-range-strict?:bool = false,
forced-min:t = {unit-value-for-type t},
forced-max:t = {unit-value-for-type t},
visible-values:{Array-of t} = {new {Array-of t}},
label-group:ChartLabelGroup = {ChartLabelGroup},
axis-group:Shape = {ShapeGroup},
axis-line-group:Shape = {ShapeGroup},
major-tick-group:Shape = {ShapeGroup},
minor-tick-group:Shape = {ShapeGroup},
...
}

プロパティ
maximum-displayed-t:この軸で表示される実際の最大値。
フィールド public-get private-set NumericDataSeriesAxis-of.maximum-displayed-t:t
minimum-displayed-t:この軸で表示される実際の最小値。
フィールド public-get private-set NumericDataSeriesAxis-of.minimum-displayed-t:t
tick-count:この軸で表示される目盛りの実際の数。
フィールド public-get private-set NumericDataSeriesAxis-of.tick-count:int
tick-spacing-proc:この NumericAxisMixin-of の境界および生成される目盛りの数を制御するために使用できるプロシージャ。
非ローカル オプション public NumericDataSeriesAxis-of.tick-spacing-proc:#TickSpacingProc
プロパティ 継承 NumericAxisMixin-of: force-range-strict?, force-range?, forced-max, forced-min, visible-values
プロパティ 継承 DataSeriesAxis: data, maximum, minimum
プロパティ 継承 ChartAxis: axis-group, axis-label, axis-line-group, chart, label-group, length, major-tick-factory, major-tick-group, minor-tick-factory, minor-tick-group, position, style-element, tick-label-factory, x-axis?, y-axis?
プロパティ 継承 DataBindingTarget: data-binding-context, data-bindings
プロパティ 継承 ShapeGroup: clonable-class?
プロパティ 継承 OptionListInterface: option-register-proc, options-present-here, registered-option-keys
プロパティ 継承 Shape: as-Shape, border-color, color, draw-operation, graphical-parent, option-parent, possibly-displayed?, selection-context, shape-parent, shape-selectable, stroke-thickness, transformation, visible?
プロパティ 継承 ShapeContainerBase: as-ShapeRoot, shape-children
プロパティ 継承 Visual: _style-element, completely-clonable-children?, cursor, data-source, display-context, dragee, font-size, has-key-focus?, input-method-enabled?, input-method-keyboard-mode, name, options, style-class, style-manager, style-options, test-child?, test-description, test-name, test-parent?, test-type-name, test-visible?, tooltip, user-data, visual-parent
プロパティ 継承 EventTarget: event-handlers

メソッド
generate-major-ticks:この軸に沿った主目盛りを表すのに必要なすべての Shape を生成します。
protected {NumericDataSeriesAxis-of.generate-major-ticks}:void
generate-minor-ticks:この軸に沿った補助目盛りを表すのに必要なすべての Shape を生成します。
protected {NumericDataSeriesAxis-of.generate-minor-ticks}:void
get-position-at-zero:この軸に沿ったゼロに対応する空間位置を取得します。
public {NumericDataSeriesAxis-of.get-position-at-zero}:Distance
get-relative-position:データ値に対応する空間位置を計算します。
public {NumericDataSeriesAxis-of.get-relative-position
val:any
}:Fraction
get-value-relative:この軸に沿った位置に対応するデータ値を計算します。
public {NumericDataSeriesAxis-of.get-value-relative
position:Fraction
}:any
note-visible-values-changed:この軸に NumericAxisMixin-of.visible-values の内容が変更されたことを通知します。
public {NumericDataSeriesAxis-of.note-visible-values-changed}:void
set-forced-range:NumericAxisMixin-of.calculate-tick-spacing でこの軸が使用する境界に制約を適用します (またはその制約を削除します)。
public {NumericDataSeriesAxis-of.set-forced-range
force-range?:bool,
force-range-strict?:bool = false,
forced-min:t = {unit-value-for-type t},
forced-max:t = {unit-value-for-type t}
}:void
メソッド 継承 NumericAxisMixin-of: calculate-tick-spacing, generate-numeric-ticks
メソッド 継承 DataSeriesAxis: generate-axis-label, generate-tick-label, get-data-type, handle-observer-message, non-keyword-init-arg, note-min-max-computation-changed
メソッド 継承 GraphicOptions: any-to-Distance
メソッド 継承 ChartAxis: clear-shapes, detach, generate-axis-line, generate-major-tick, generate-minor-tick, get-axis-label, get-major-ticks-Iterator, get-minor-ticks-Iterator, get-position, get-tick-label, get-tick-label-alignment, get-value, regenerate-shapes, transform-from-chart, transform-to-chart, update-layout
メソッド 継承 Observer: observe, stop-observing
メソッド 継承 DataBindingTarget: add-data-binding, get-data-binding, refresh-data-binding, remove-data-binding, unset-property, update-data-binding, validate-data-binding
メソッド 継承 ShapeGroup: clone-appearance-helper, draw, get-own-bounds, get-own-bounds-in-shape-root, self-contains-point?, self-intersects-polygon?
メソッド 継承 OptionListInterface: add-option, add-style-option, change-option-parent-notify, clone-options, get-option, get-option-by-name, local-add-notify, local-remove-notify, name-to-option-key, new-option-item, option-changed, option-lookup, option-lookup-here, option-propagate-notify, option-set?, propagate-option-change, remove-option, remove-style-option, remove-styles, set-option-by-name, set-style-option-by-name, unset-option-by-name, unset-style-option-by-name
メソッド 継承 Shape: apply-rotation, apply-scale, apply-transformation, apply-translation, apply-translation-in-parent, constrain-own-layout-bounds, constrain-shape-layout-bounds, contains-point?, find-graphical-ancestor, fire-crossing-event, fire-in-child, get-display-context, get-down-orientation-in-shape-parent, get-graphical-root, get-gui-path, get-gui-path-to-child, get-local-device-pixel-size, get-origin-in-graphical-ancestor, get-origin-in-root, get-origin-in-shape-parent, get-origin-in-shape-root, get-own-layout-bounds, get-right-orientation-in-shape-parent, get-shape-bounds, get-shape-bounds-in-shape-root, get-shape-layout-bounds, get-top-left-in-ancestor, get-transformation-to-shape-root, keyword-init-arg, option-change-notify, overdraw-for-selection, quantize-line-thickness, request-draw, request-draw-self, reset-transformation, set-rotation, set-scale, set-transformation, set-translation-in-parent, to-Graphic, transform-from-display-coordinates, transform-from-graphical-root-coordinates, transform-point-from-shape-root, transform-point-to-shape-root, transform-to-display-coordinates, transform-to-graphical-root-coordinates, transform-vector-from-shape-root, transform-vector-to-shape-root, transformation-changed, transformation-changing
メソッド 継承 InitRestArgParser: process-rest-args
メソッド 継承 ShapeContainerBase: add, clear, clone-children, draw-shape-child, draw-shape-children, get-all-children-at-point, get-child-at-point, get-leaf-at-point, get-shape-root, note-attached, note-detaching, notify-option-children, on-drag-enter, on-pointer-enter, on-pointer-envelope-event, register-options, remove, set-shape-index, set-shape-index-after, set-shape-index-before, shape-container-fire-inferior-crossing-event, shape-container-handle-crossing, shape-container-pick-child, shape-container-pointer-enter-occurred, shape-container-pointer-leave-occurred
メソッド 継承 Visual: add-from-init-args, animate, change-cursor, clonable-appearance?, clone-appearance, find-test-children, get-focus-manager, get-layout-context, get-test-parent, get-test-property, get-text, get-view, maybe-fire-attach-event, maybe-fire-detach-event, note-caret-position, on-drag-leave, on-pointer-leave, pop-cursor, prepare-test-object, prepare-test-parent, push-cursor, quantize-width, refresh-style-options, release-key-focus, request-key-focus, scroll-to-include, test-record, test-run, xy-offset-to
メソッド 継承 GuiEventTarget: handle-delegate-event, handle-event, on-action, on-cancel-mode, on-command-changed, on-commit, on-composition-change-event, on-composition-result-event, on-context-menu-event, on-current-record-change-request, on-current-record-changed, on-destroy-notify, on-destroy-requested, on-drag-over, on-drag-pointer, on-drag-started, on-drop, on-end-composition-event, on-focus-event, on-focus-in, on-focus-out, on-gesture, on-gesture-begin, on-gesture-end, on-gesture-magnify, on-gesture-pan, on-gesture-rotate, on-gesture-swipe, on-gesture-tap, on-gesture-touch, on-grab-release, on-gui-event, on-input-method-event, on-inspection, on-key-event, on-key-press, on-pointer-button, on-pointer-crossing, on-pointer-event, on-pointer-motion, on-pointer-press, on-pointer-release, on-pointer-scroll, on-raw-key-event, on-raw-key-press, on-raw-key-release, on-reset, on-selectable-added, on-selectable-removed, on-selection-changed, on-selection-context-activated, on-selection-context-deactivated, on-selection-event, on-start-composition-event, on-start-event, on-stop-event, on-view-activate, on-view-deactivate, on-window-close, remove-event-handlers-for-event-class
メソッド 継承 EventTarget: accepts-event-class?, add-event-handler, event-handler-present?, remove-event-handler, verify-event
メソッド 継承 BasicEventTarget: enqueue-event
メソッド 継承 Object: object-describe, object-describe-for-debugging, object-serialize


コンストラクタ詳細
default (コンストラクタ)
public {NumericDataSeriesAxis-of.default
force-zero?:bool = true,
force-range?:bool = false,
force-range-strict?:bool = false,
forced-min:t = {unit-value-for-type t},
forced-max:t = {unit-value-for-type t},
visible-values:{Array-of t} = {new {Array-of t}},
label-group:ChartLabelGroup = {ChartLabelGroup},
axis-group:Shape = {ShapeGroup},
axis-line-group:Shape = {ShapeGroup},
major-tick-group:Shape = {ShapeGroup},
minor-tick-group:Shape = {ShapeGroup},
...
}

新しい NumericDataSeriesAxis-of オブジェクトを作成します。

force-zero?: true の場合、この軸の最小値と最大値は、ゼロが表現されるように必要に応じて調整されます。(この機能は、visible-values にゼロを追加することによって実装されます。)
force-range?: true の場合、forced-min および forced-max がこの軸の境界を設定するために使用されます。
force-range-strict?: true の場合、forced-min および forced-max は、変更なしにこの軸の境界となります。そうでない場合は、最も近い概数値に調整されます。
forced-min: force-range?true の場合にこの軸の最小値として使用される値。
forced-max: force-range?true の場合にこの軸の最大値として使用される値。
visible-values: この軸の境界内に常に含まれる値の配列。NumericAxisMixin-of.visible-values を参照してください。
label-group: ChartAxis.label-group の初期値。
axis-group: ChartAxis.axis-group の初期値。
axis-line-group: ChartAxis.axis-line-group の初期値。
major-tick-group: ChartAxis.major-tick-group の初期値。
minor-tick-group: ChartAxis.minor-tick-group の初期値。
...: 非キーワード引数は、この軸への追加用に ChartDataSeries とすることができます。そうでない場合、残余引数は、Shape が受け取るいずれかの引数とすることができます。これらは主に、オプションの初期化を表すキーワード引数です。

NumericDataSeriesAxis-of を参照してください。


プロパティ詳細
maximum-displayed-t (フィールド)
public-get private-set NumericDataSeriesAxis-of.maximum-displayed-t:t

この軸で表示される実際の最大値。

説明

この値は、レイアウト処理の過程で NumericDataSeriesAxis-of.generate-major-ticks 内で計算されます。したがって、これが有効で、意味を持つのは、レイアウト処理が完了したグラフ内にこの軸が含まれる場合だけです。(Chart.ensure-layout-valid を参照してください。)


minimum-displayed-t (フィールド)
public-get private-set NumericDataSeriesAxis-of.minimum-displayed-t:t

この軸で表示される実際の最小値。

説明

この値は、レイアウト処理の過程で NumericDataSeriesAxis-of.generate-major-ticks 内で計算されます。したがって、これが有効で、意味を持つのは、レイアウト処理が完了したグラフ内にこの軸が含まれる場合だけです。(Chart.ensure-layout-valid を参照してください。)


tick-count (フィールド)
public-get private-set NumericDataSeriesAxis-of.tick-count:int

この軸で表示される目盛りの実際の数。

説明

この値は、レイアウト処理の過程で NumericDataSeriesAxis-of.generate-major-ticks 内で計算されます。したがって、これが有効で、意味を持つのは、レイアウト処理が完了したグラフ内にこの軸が含まれる場合だけです。(Chart.ensure-layout-valid を参照してください。)


tick-spacing-proc (非ローカル オプション)
public NumericDataSeriesAxis-of.tick-spacing-proc:#TickSpacingProc

この NumericAxisMixin-of の境界および生成される目盛りの数を制御するために使用できるプロシージャ。

説明

tick-spacing-proc を参照してください。


メソッド詳細
generate-major-ticks (メソッド)
protected {NumericDataSeriesAxis-of.generate-major-ticks}:void

この軸に沿った主目盛りを表すのに必要なすべての Shape を生成します。

説明

これは、ChartAxis の実装で、生成する目盛りの数、目盛りを配置する場所、およびその方法を明らかにして、実際に実行するメソッドです。このメソッドは、ChartAxis.update-layout から呼び出されることを想定しています。
このメソッドを実装する場合は、ChartAxis.generate-major-tick を使用して、標準の目盛り形状を作成すると便利です。生成された Shape は、ChartAxis.major-tick-group に追加されます。


generate-minor-ticks (メソッド)
protected {NumericDataSeriesAxis-of.generate-minor-ticks}:void

この軸に沿った補助目盛りを表すのに必要なすべての Shape を生成します。

説明

これは、ChartAxis.generate-major-ticks に対応する補助目盛りです。標準軸を実装しても補助目盛りは生成されないので、ChartAxis.generate-minor-ticks は何も実行しません。このメソッドは、ChartAxis.update-layout から呼び出されることを想定しています。
このメソッドを実装しようとする場合は、ChartAxis.generate-minor-tick を使用して、標準の目盛り形状を作成すると便利です。生成された Shape は、ChartAxis.minor-tick-group に追加されます。


get-position-at-zero (メソッド)
public {NumericDataSeriesAxis-of.get-position-at-zero}:Distance

この軸に沿ったゼロに対応する空間位置を取得します。

説明

これにより、値は ChartAxis.get-position と同じ動作を持つこの軸の長さと共に返されます。詳細については、該当のメソッドを参照してください。

注意事項

ゼロの概念は、すべての軸で意味を持つわけではありません。具体的には、GenericDataSeriesAxis および EnumeratedBarChartAxis は序数軸であって、連続値ベースの軸でないので、ゼロの概念は適用しません。こうした軸では常に 0m が返されます。


get-relative-position (メソッド)
public {NumericDataSeriesAxis-of.get-relative-position
val:any
}:Fraction

データ値に対応する空間位置を計算します。

value: 軸の種類によって、必要な型が異なる値。ChartAxis.get-position を参照してください。互換性のない型を渡すとエラーが発生します。

戻り値

軸に沿ったデータ値の位置を示す Fraction。軸の原点の 0 から、軸の終点の 1 までです。

説明

これは基本的に、軸の方向または長さの概念がない ChartAxis.get-position と同じです。実際、このメソッドはこの意味で実装されます。詳細については、ChartAxis.get-position を参照してください。


get-value-relative (メソッド)
public {NumericDataSeriesAxis-of.get-value-relative
position:Fraction
}:any

この軸に沿った位置に対応するデータ値を計算します。

position: この軸に沿った位置 (分数として)。これは、01 の間にある必要があります。

戻り値

この軸に適切な型の値。各種の軸に適切な値の Type については、ChartAxis.get-position を参照してください。

説明

これは基本的に、軸の方向または長さの概念がない ChartAxis.get-value と同じです。実際、このメソッドはこの意味で実装されます。詳細については、ChartAxis.get-value を参照してください。


note-visible-values-changed (メソッド)
public {NumericDataSeriesAxis-of.note-visible-values-changed}:void

この軸に NumericAxisMixin-of.visible-values の内容が変更されたことを通知します。

説明

軸で必要なレイアウト操作を実行できるようにするために、NumericAxisMixin-of.visible-values の内容を変更する場合には、必ずこのメソッドを呼び出す必要があります。


set-forced-range (メソッド)
public {NumericDataSeriesAxis-of.set-forced-range
force-range?:bool,
force-range-strict?:bool = false,
forced-min:t = {unit-value-for-type t},
forced-max:t = {unit-value-for-type t}
}:void

NumericAxisMixin-of.calculate-tick-spacing でこの軸が使用する境界に制約を適用します (またはその制約を削除します)。

force-range?: true の場合、この軸に表示される範囲は、このメソッドの他のパラメータによって決定されます。そうでない場合、その範囲はデータからの最小値と最大値に基づいており、このメソッドに対する他のパラメータは無視されます。
force-range-strict?: true の場合、forced-min および forced-max は、変更なしにこの軸の境界となります。そうでない場合は、最も近い概数値に調整されます。
forced-min: force-range?true の場合にこの軸の最小値として使用される値。
forced-max: force-range?true の場合にこの軸の最大値として使用される値。

説明

このメソッドを使用して、この軸で表示されるデータ境界を制御できます。通常、NumericAxisMixin-of.calculate-tick-spacing は、データ内にある最小値と最大値で決定された境界で始まります。ただし、force-range? を true として指定すると、データの最小値と最大値ではなく、forced-minforced-max が使用されます。
通常、この最小値と最大値のソースに関係なく、NumericAxisMixin-of.calculate-tick-spacing が最適な目盛り間隔を決定し、境界をこの間隔の最も近い倍数値に切り上げます。ただし、force-range-strict?true であると、forced-minforced-max は、切り上げなしに常にそのまま使用されます。
強制範囲の有効性には関係なく、NumericAxisMixin-of.visible-values が適用されることに注意してください。

注意事項

これらの値は、NumericAxisMixin-of.default コンストラクタから、または NumericDataSeriesAxis-of.default コンストラクタと NumericAxis-of.default コンストラクタから初期化することもできます。


例: 次の使用: NumericAxisMixin-of.set-forced-range
{import * from CURL.GUI.CHARTS}
{import * from CHARTS-DOC,
    location = "../docstring-support/gui/charts-doc.scurl"
}

{let constant axis:{NumericDataSeriesAxis-of double} =
    {new {NumericDataSeriesAxis-of double},
        {ChartDataSeries sample-records, "Age"},
        {ChartDataSeries sample-records, "Points"},
        force-zero? = false,
        force-range? = true,
        force-range-strict? = false,
        forced-min = 1.5,
        forced-max = 7.5
    }
}

{LayeredChart
    width = 15cm,
    height = 7cm,
    left-axis = axis,
    {LineLayer
        sample-records,
        "Age",
        "Points",
        x-axis-data =
            {ChartDataSeries sample-records, "Name"}
    }
}

{Table
    columns = 2,
    {text forced-min:},
    {TextField
        value = "" & axis.forced-min,
        {on ValueFinished at tf:TextField do
            {axis.set-forced-range
                axis.force-range?,
                force-range-strict? = axis.force-range-strict?,
                forced-min = {tf.value.to-double},
                forced-max = axis.forced-max
            }
        }
    },
    {text forced-max:},
    {TextField
        value = "" & axis.forced-max,
        {on ValueFinished at tf:TextField do
            {axis.set-forced-range
                axis.force-range?,
                force-range-strict? = axis.force-range-strict?,
                forced-min = axis.forced-min,
                forced-max = {tf.value.to-double}
            }
        }
    }
}

{CheckButton
    label = "force-range?",
    value = axis.force-range?,
    {on ValueFinished at cb:CheckButton do
        {axis.set-forced-range
            cb.value,
            force-range-strict? = axis.force-range-strict?,
            forced-min = axis.forced-min,
            forced-max = axis.forced-max
        }
    }
}

{CheckButton
    label = "force-range-strict?",
    value = axis.force-range-strict?,
    {on ValueFinished at cb:CheckButton do
        {axis.set-forced-range
            axis.force-range?,
            force-range-strict? = cb.value,
            forced-min = axis.forced-min,
            forced-max = axis.forced-max
        }
    }
}