円グラフの外観を呈する
説明
PieChart は PieSet オブジェクトから構成されますが、これは、LayeredChart が ChartLayer から構成されているのとよく似ています。ただし、重なりはありません。各 PieSet は、1 つの円グラフでの同心円状の輪です。一般的に、1 つの PieSet しかないので、従来の円グラフとなります。
注意事項
このオブジェクトは、"PieChart"のスタイル ルールを記述することでスタイル化することが出来ます。
例
| 例: PieChart の使用 | |
 | |
{import * from CURL.GUI.CHARTS}
{import * from CHARTS-DOC,
location = "../docstring-support/gui/charts-doc.scurl"
}
{AntialiasedFrame
{PieChart
width = 10cm,
height = 10cm,
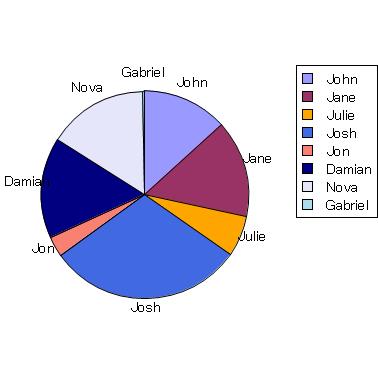
{PieSet
sample-records,
"Age",
label-data = {ChartDataSeries sample-records, "Name"}
}
}
}
|
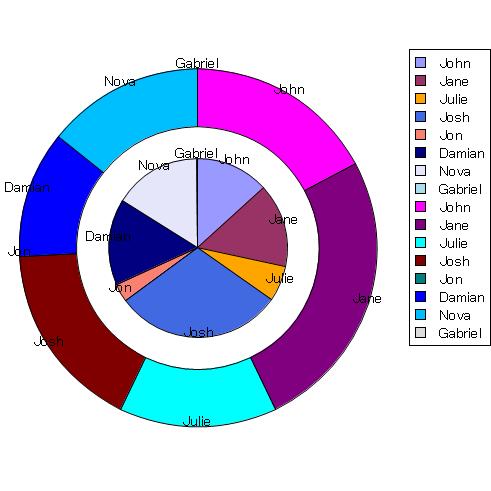
この例は、複数円セットを示しています。PieSet.wedge-labels? は、グラフを鮮明にするためのラベル生成の禁止に使用されます。内側の輪は "Age" データ系列に対応し、外側の輪は "Wins" に対応します。
| 例: PieChart 内部の複数の PieSet | |
 | |
{import * from CURL.GUI.CHARTS}
{import * from CHARTS-DOC,
    location = "../docstring-support/gui/charts-doc.scurl"
}
{PieChart
    width = 10cm,
    height = 10cm,
    pie-set-inner-margin = .5cm,
    {PieSet
        sample-records,
        "Age",
        wedge-labels? = false,
        label-data =
            {ChartDataSeries sample-records, "Name"}
    },
    {PieSet
        sample-records,
        "Wins",
        wedge-labels? = false,
        label-data =
            {ChartDataSeries sample-records, "Name"}
    }
}
|
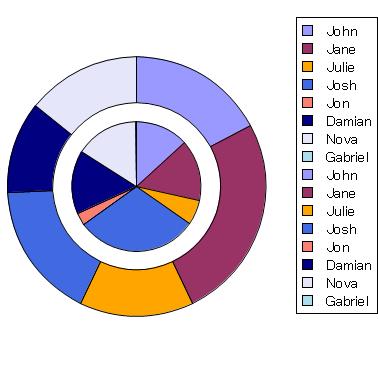
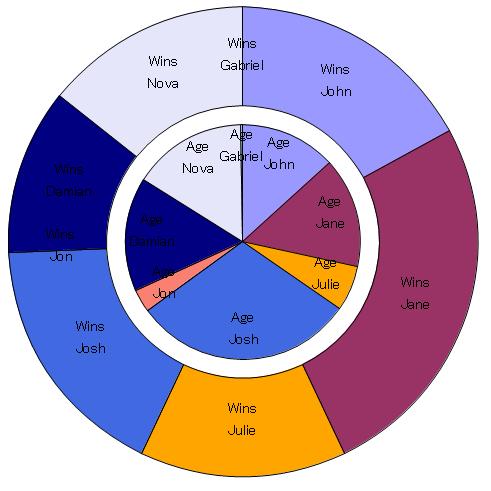
最後に、この例は、PieSet.label-set? プロパティで複数の円セットを使用し、各輪でグラフ化されるものを説明するラベルの表示方法を示しています。
| 例: PieSet.label-set? の使用 | |
 | |
{import * from CURL.GUI.CHARTS}
{import * from CHARTS-DOC,
    location = "../docstring-support/gui/charts-doc.scurl"
}

{PieChart
    width = 13cm,
    height = 13cm,
    pie-set-inner-margin = .5cm,
    pie-label-radius = -7mm,
    legend-enabled? = false,
    {PieSet
        sample-records,
        "Age",
        label-set? = true,
        label-data =
            {ChartDataSeries sample-records, "Name"}
    },
    {PieSet
        sample-records,
        "Wins",
        pie-label-radius = -14mm,
        label-set? = true,
        label-data =
            {ChartDataSeries sample-records, "Name"}
    }
}
|
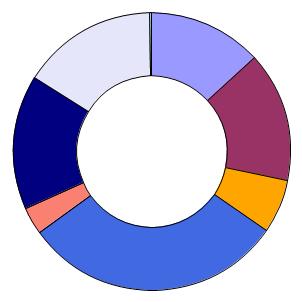
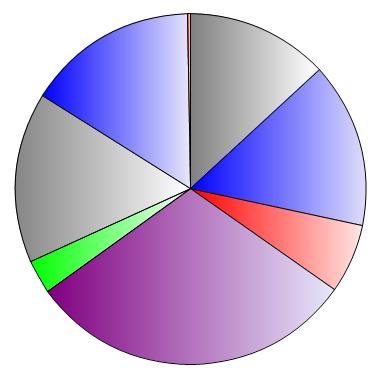
この例は、PieChart でのグラジェントの使用法を示しています。
| 例: 次でのグラジェントの使用: PieChart | |
 | |
{import * from CURL.GUI.CHARTS}
{import * from CHARTS-DOC,
    location = "../docstring-support/gui/charts-doc.scurl"
}

{define-proc package {h-gradient
                         start-color:FillPattern,
                         end-color:FillPattern
                     }:FillPattern
    {return
        {LinearGradientFillPattern
            {Fraction2d 0, 0},
            {Fraction2d 1, 0},
            {Spectrum.from-envelope
                start-color,
                0.0,
                end-color,
                1.0
            }
        }
    }
}

{PieChart
    width = 10cm,
    height = 10cm,
    color-palette =
        {new {Array-of FillPattern},
            {h-gradient "gray", "white"},
            {h-gradient "blue", "lavender"},
            {h-gradient "red", "mistyrose"},
            {h-gradient "purple", "lavender"},
            {h-gradient "lime", "mintcream"}
        },
    {PieSet
        sample-records,
        "Age"
    }
}
|