SimpleDateTimeAxis (クラス)
public SimpleDateTimeAxis {inherits DataSeriesAxis}
パッケージ: CURL.GUI.CHARTS

DateTime 値に適切に対処できるように設計された ChartAxis の実装です。

説明

既定では、この軸は自動的に指定された時間軸の範囲を決定し、その目盛りの生成と表示範囲を調整します。またこの処理に対して変更を加えることができます。例として、SimpleDateTimeAxis.tick-spanSimpleDateTimeAxis.round-extents-to-tick-span? を参照して下さい。
動作中の SimpleDateTimeAxis に関しては SimpleDateTimeAxis.tick-span を参照して下さい。

注意事項

それらの中に埋め込まれたタイムゾーンに従って、全ての DateTime の値は解釈されラベル化されます。異なったタイムゾーンから値を使用することは、混乱を招く可能性があります。例えば、軸ラベルに正しく合致しないデータを使用したり、軸ラベルのタイムゾーンをユーザが誤認識してしまうことがあります。
従って既定では、全てのデータはローカルタイムゾーンで正常化されます。詳細については SimpleDateTimeAxis.display-time-zone を参照して下さい。
導入: バージョン 8.0

コンストラクタ
default:新しい SimpleDateTimeAxis を作成します。
コンストラクタ public {SimpleDateTimeAxis.default
label-group:ChartLabelGroup = {ChartLabelGroup},
axis-group:Shape = {ShapeGroup},
axis-line-group:Shape = {ShapeGroup},
major-tick-group:Shape = {ShapeGroup},
minor-tick-group:Shape = {ShapeGroup},
...
}

プロパティ
actual-tick-span:この軸の目盛りを生成するために使用する実際のタイムスケール。
フィールド public-get private-set SimpleDateTimeAxis.actual-tick-span:DateTimeAxisTimeSpan =DateTimeAxisTimeSpan.auto
allowed-distance-to-first-tick:軸が主目盛りを表示される目盛りの初めに追加される際の調整を行います。
ローカル オプション public SimpleDateTimeAxis.allowed-distance-to-first-tick:Distance =1cm
display-time-zone:特定の DateTimeZone に対して、入力された DateTime を標準化することを許可します。
ローカル オプション public SimpleDateTimeAxis.display-time-zone:#DateTimeZone =DateTimeZone.local
gap-finder:When non-null, this DateTimeGapFinder will be used to establish gaps in the times on this axis.
ローカル オプション public SimpleDateTimeAxis.gap-finder:#DateTimeGapFinder =null
gaps:An array containing the actual gaps elided when the current contents of the chart were generated.
フィールド public-get private-set SimpleDateTimeAxis.gaps:#{Array-of ChartDateTimeSpan} =null
minimum-space-per-major-tick:この軸の主目盛りあたりの最小スペース (Distance の単位で) を指定します。
ローカル オプション public SimpleDateTimeAxis.minimum-space-per-major-tick:{FastArray-of Distance} =standard-desired-major-tick-space-per-span
minimum-space-per-minor-tick:この軸の副目盛りあたりの最小スペース (Distance の単位で) を指定します。
ローカル オプション public SimpleDateTimeAxis.minimum-space-per-minor-tick:Distance =0.35cm
round-extents-to-tick-span?:この軸を拡張して、(SimpleDateTimeAxis.tick-span に従って)採用されている時間単位の倍数に最も近い倍数に丸められるかを指定します。
ローカル オプション public SimpleDateTimeAxis.round-extents-to-tick-span?:bool =false
start-of-week:週に対応する日付の目盛りを決定するために、週の始まりを指定します。
ローカル オプション public SimpleDateTimeAxis.start-of-week:int =1
tick-span:この軸の目盛りを生成するために使用する時間単位を指定します。
ローカル オプション public SimpleDateTimeAxis.tick-span:DateTimeAxisTimeSpan =DateTimeAxisTimeSpan.auto
プロパティ 継承 DataSeriesAxis: data, maximum, minimum
プロパティ 継承 ChartAxis: axis-group, axis-label, axis-line-group, chart, label-group, length, major-tick-factory, major-tick-group, minor-tick-factory, minor-tick-group, position, style-element, tick-label-factory, x-axis?, y-axis?
プロパティ 継承 ShapeGroup: clonable-class?
プロパティ 継承 Shape: as-Shape, border-color, color, draw-operation, graphical-parent, option-parent, possibly-displayed?, selection-context, shape-parent, shape-selectable, stroke-thickness, transformation, visible?
プロパティ 継承 ShapeContainerBase: as-ShapeRoot, shape-children
プロパティ 継承 Visual: _style-element, completely-clonable-children?, cursor, data-source, display-context, dragee, font-size, has-key-focus?, input-method-enabled?, input-method-keyboard-mode, name, options, style-class, style-manager, style-options, test-child?, test-description, test-name, test-parent?, test-type-name, test-visible?, tooltip, user-data, visual-parent
プロパティ 継承 DataBindingTarget: data-binding-context, data-bindings
プロパティ 継承 EventTarget: event-handlers
プロパティ 継承 OptionListInterface: option-register-proc, options-present-here, registered-option-keys

メソッド
generate-major-tick:主目盛りを表す Shape を生成します。
public {SimpleDateTimeAxis.generate-major-tick
value:any,
tick-index:int,
position:Distance = {self.get-position value}
}:Shape
generate-major-ticks:この軸に沿った主目盛りを表すのに必要なすべての Shape を生成します。
protected {SimpleDateTimeAxis.generate-major-ticks}:void
generate-minor-tick:補助目盛りを表す Shape を生成します。
public {SimpleDateTimeAxis.generate-minor-tick
value:any,
tick-index:int,
position:Distance = {self.get-position value}
}:Shape
generate-minor-ticks:この軸に沿った補助目盛りを表すのに必要なすべての Shape を生成します。
protected {SimpleDateTimeAxis.generate-minor-ticks}:void
generate-tick-label:指定の目盛りの目盛りラベルを生成します。
public {SimpleDateTimeAxis.generate-tick-label
tick:ChartTick,
tick-rotation:Angle
}:#Shape
get-display-zone:この軸に沿って値を表示するために使用される DateTimeZone を取得します。
public {SimpleDateTimeAxis.get-display-zone}:DateTimeZone
get-position-at-zero:この軸に沿ったゼロに対応する空間位置を取得します。
public {SimpleDateTimeAxis.get-position-at-zero}:Distance
get-relative-position:データ値に対応する空間位置を計算します。
public {SimpleDateTimeAxis.get-relative-position val:any}:Fraction
get-value-relative:この軸に沿った位置に対応するデータ値を計算します。
public {SimpleDateTimeAxis.get-value-relative
position-frac:Fraction
}:any
normalize-value:適切な DateTimeZone に変換することによって DateTime 値を標準化します。
public {SimpleDateTimeAxis.normalize-value val:DateTime}:DateTime
update-layout:軸に必要なすべてのレイアウト操作を実行します。
public {SimpleDateTimeAxis.update-layout length:Distance}:void
メソッド 継承 DataSeriesAxis: generate-axis-label, get-data-type, handle-observer-message, non-keyword-init-arg, note-min-max-computation-changed
メソッド 継承 ChartAxis: clear-shapes, detach, generate-axis-line, get-axis-label, get-major-ticks-Iterator, get-minor-ticks-Iterator, get-position, get-tick-label, get-tick-label-alignment, get-value, regenerate-shapes, transform-from-chart, transform-to-chart
メソッド 継承 Observer: observe, stop-observing
メソッド 継承 ShapeGroup: clone-appearance-helper, draw, get-own-bounds, get-own-bounds-in-shape-root, self-contains-point?, self-intersects-polygon?
メソッド 継承 Shape: apply-rotation, apply-scale, apply-transformation, apply-translation, apply-translation-in-parent, constrain-own-layout-bounds, constrain-shape-layout-bounds, contains-point?, find-graphical-ancestor, fire-crossing-event, fire-in-child, get-display-context, get-down-orientation-in-shape-parent, get-graphical-root, get-gui-path, get-gui-path-to-child, get-local-device-pixel-size, get-origin-in-graphical-ancestor, get-origin-in-root, get-origin-in-shape-parent, get-origin-in-shape-root, get-own-layout-bounds, get-right-orientation-in-shape-parent, get-shape-bounds, get-shape-bounds-in-shape-root, get-shape-layout-bounds, get-top-left-in-ancestor, get-transformation-to-shape-root, keyword-init-arg, option-change-notify, overdraw-for-selection, quantize-line-thickness, request-draw, request-draw-self, reset-transformation, set-rotation, set-scale, set-transformation, set-translation-in-parent, to-Graphic, transform-from-display-coordinates, transform-from-graphical-root-coordinates, transform-point-from-shape-root, transform-point-to-shape-root, transform-to-display-coordinates, transform-to-graphical-root-coordinates, transform-vector-from-shape-root, transform-vector-to-shape-root, transformation-changed, transformation-changing
メソッド 継承 ShapeContainerBase: add, clear, clone-children, draw-shape-child, draw-shape-children, get-all-children-at-point, get-child-at-point, get-leaf-at-point, get-shape-root, note-attached, note-detaching, notify-option-children, on-drag-enter, on-pointer-enter, on-pointer-envelope-event, register-options, remove, set-shape-index, set-shape-index-after, set-shape-index-before, shape-container-fire-inferior-crossing-event, shape-container-handle-crossing, shape-container-pick-child, shape-container-pointer-enter-occurred, shape-container-pointer-leave-occurred
メソッド 継承 Visual: add-from-init-args, animate, change-cursor, clonable-appearance?, clone-appearance, find-test-children, get-focus-manager, get-layout-context, get-test-parent, get-test-property, get-text, get-view, maybe-fire-attach-event, maybe-fire-detach-event, note-caret-position, on-drag-leave, on-pointer-leave, pop-cursor, prepare-test-object, prepare-test-parent, push-cursor, quantize-width, refresh-style-options, release-key-focus, request-key-focus, scroll-to-include, test-record, test-run, xy-offset-to
メソッド 継承 GraphicOptions: any-to-Distance
メソッド 継承 GuiEventTarget: handle-delegate-event, handle-event, on-action, on-cancel-mode, on-command-changed, on-commit, on-composition-change-event, on-composition-result-event, on-context-menu-event, on-current-record-change-request, on-current-record-changed, on-destroy-notify, on-destroy-requested, on-drag-over, on-drag-pointer, on-drag-started, on-drop, on-end-composition-event, on-focus-event, on-focus-in, on-focus-out, on-gesture, on-gesture-begin, on-gesture-end, on-gesture-magnify, on-gesture-pan, on-gesture-rotate, on-gesture-swipe, on-gesture-tap, on-gesture-touch, on-grab-release, on-gui-event, on-input-method-event, on-inspection, on-key-event, on-key-press, on-pointer-button, on-pointer-crossing, on-pointer-event, on-pointer-motion, on-pointer-press, on-pointer-release, on-pointer-scroll, on-raw-key-event, on-raw-key-press, on-raw-key-release, on-reset, on-selectable-added, on-selectable-removed, on-selection-changed, on-selection-context-activated, on-selection-context-deactivated, on-selection-event, on-start-composition-event, on-start-event, on-stop-event, on-view-activate, on-view-deactivate, on-window-close, remove-event-handlers-for-event-class
メソッド 継承 DataBindingTarget: add-data-binding, get-data-binding, refresh-data-binding, remove-data-binding, unset-property, update-data-binding, validate-data-binding
メソッド 継承 EventTarget: accepts-event-class?, add-event-handler, event-handler-present?, remove-event-handler, verify-event
メソッド 継承 OptionListInterface: add-option, add-style-option, change-option-parent-notify, clone-options, get-option, get-option-by-name, local-add-notify, local-remove-notify, name-to-option-key, new-option-item, option-changed, option-lookup, option-lookup-here, option-propagate-notify, option-set?, propagate-option-change, remove-option, remove-style-option, remove-styles, set-option-by-name, set-style-option-by-name, unset-option-by-name, unset-style-option-by-name
メソッド 継承 BasicEventTarget: enqueue-event
メソッド 継承 InitRestArgParser: process-rest-args
メソッド 継承 Object: object-describe, object-describe-for-debugging, object-serialize


コンストラクタ詳細
default (コンストラクタ)
public {SimpleDateTimeAxis.default
label-group:ChartLabelGroup = {ChartLabelGroup},
axis-group:Shape = {ShapeGroup},
axis-line-group:Shape = {ShapeGroup},
major-tick-group:Shape = {ShapeGroup},
minor-tick-group:Shape = {ShapeGroup},
...
}

新しい SimpleDateTimeAxis を作成します。

label-group: ChartAxis.label-group の初期値。
axis-group: ChartAxis.axis-group の初期値。
axis-line-group: ChartAxis.axis-line-group の初期値。
major-tick-group: ChartAxis.major-tick-group の初期値。
minor-tick-group: ChartAxis.minor-tick-group の初期値。
...: Shape が受け取る引数のいずれか。これらは主に、オプションの初期化を表すキーワード引数です。

SimpleDateTimeAxis が動作しているサンプルは tick-span を参照して下さい。
導入: バージョン 8.0


プロパティ詳細
actual-tick-span (フィールド)
public-get private-set SimpleDateTimeAxis.actual-tick-span:DateTimeAxisTimeSpan =DateTimeAxisTimeSpan.auto

この軸の目盛りを生成するために使用する実際のタイムスケール。

説明

このフィールドの値は tick-spanDateTimeAxisTimeSpan.auto に設定されない限り、SimpleDateTimeAxis.tick-span と同じになります。このような場合、actual-tick-spanSimpleDateTimeAxis がデータに基づいて計算する単位に設定されます。

注意事項

この値はグラフのレイアウト処理によって設定され、レイアウトが発生するまで有効ではありません。レイアウト処理が完了する時、その通知を受け取るために ChartLayoutChanged を使用できます。

目盛り単位を変更・検証しているサンプルは、tick-span を参照して下さい。
導入: バージョン 8.0


allowed-distance-to-first-tick (ローカル オプション)
public SimpleDateTimeAxis.allowed-distance-to-first-tick:Distance =1cm

軸が主目盛りを表示される目盛りの初めに追加される際の調整を行います。

説明

通常の操作 (少なくとも round-extents-to-tick-span? が false の場合) の間、最初の主目盛りが軸の始まり (例えば左下) から離れたところに配置される事は一般的です。図によっては、これは見た目上美しくない場合があります。allowed-distance-to-first-tick オプションはこれを指定する方法です。
最初の目盛りが少なくとも軸の始まりから遠くにある場合、追加の目盛りは軸の始まりに配置されます。
余分な目盛りを表示したくない場合、この値を infinity * 1m に設定します。

このオプションが動作しているサンプルは、SimpleDateTimeAxis.round-extents-to-tick-span? を参照して下さい。
導入: バージョン 8.0


display-time-zone (ローカル オプション)
public SimpleDateTimeAxis.display-time-zone:#DateTimeZone =DateTimeZone.local

特定の DateTimeZone に対して、入力された DateTime を標準化することを許可します。

説明

入力される DateTime は混乱を避けるために一つのタイムゾーンに従って表示すべきです。このオプションが non-null である場合、全てのデータは処理される前に指定されたタイムゾーンに変換されます。
このオプションが null である場合、全ての入力されるデータは一つのタイムゾーンに標準化されますが、そのタイムゾーンはデータから選択されます。

注意事項

1970年以前や2038年以降を含む幅広い期間を表示したい場合、ローカルタイムゾーンは期間に制限があるので UTC タイムゾーンを使用しなければなりません。display-time-zone オプションに DateTimeZone.utc を設定することは推奨されており、UTC 時間の範囲の外にある DateTime 値も保証されます。
データが表示のために一つのタイムゾーンに標準化されない場合、表示される結果はユーザにとって混乱の元になるかもしれません。例えば、データに UTC とローカルタイムゾーンを混ぜた場合、軸ラベルと目盛りは一つのタイムゾーンに決められます。しかし、どれが選択されるかは予測できません。目盛りにプロットされたデータ位置は正しいですが、それは間違っているように見えるかもしません。例えば、データ位置が UTC 時間における 07:00 にある場合、軸が US PDT 時間を元にしていると真夜中になっています。これは技術的に正しいのですが、恐らく UTC で考えているユーザを驚かすことになるかもしれません。
表示されているタイムゾーンにデータがない場合、入力される時間データの標準化は、望まないメモリアロケーションにより若干パフォーマンスは悪くなるかもしれません。グラフがレイアウトされる度に処理コストが掛かるので、再描画前にデータの表示のタイムゾーンの標準化を実行することは効果的であるかもしれません。
図にする時に入力されるデータの標準化を抑制するかカスタマイズする場合、SimpleDateTimeAxis.normalize-value をオーバーライドしてください。

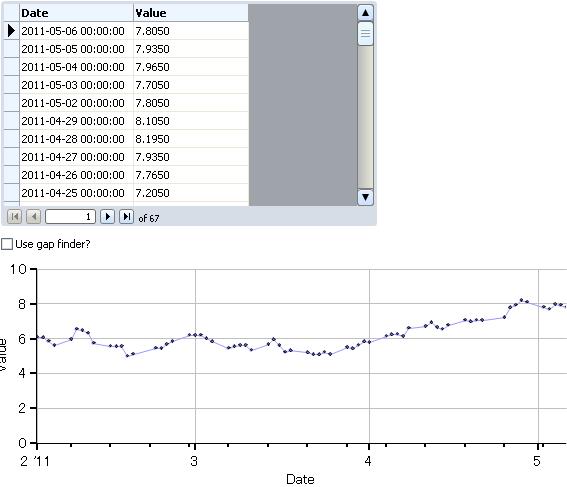
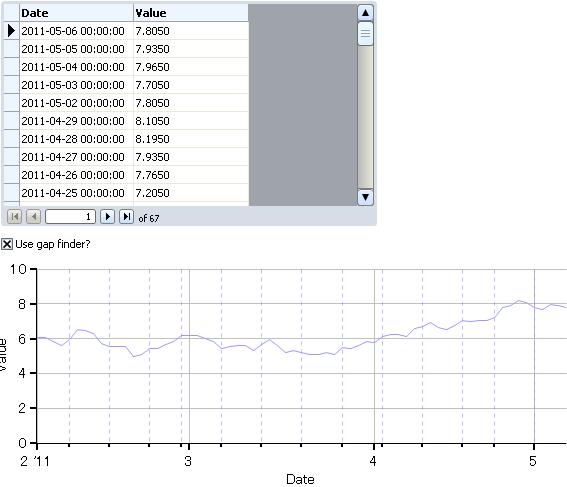
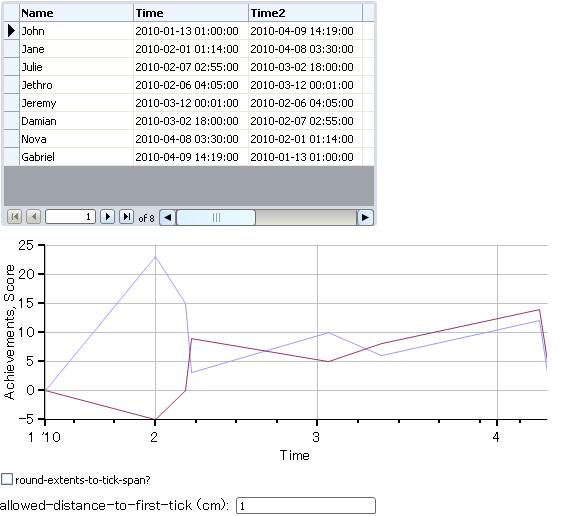
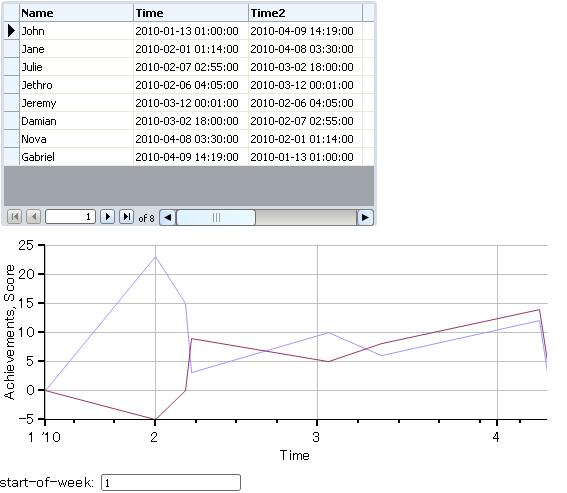
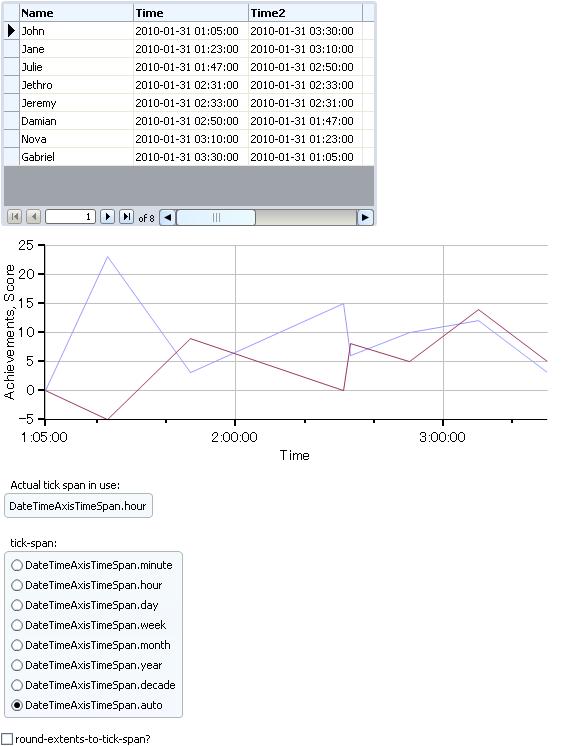
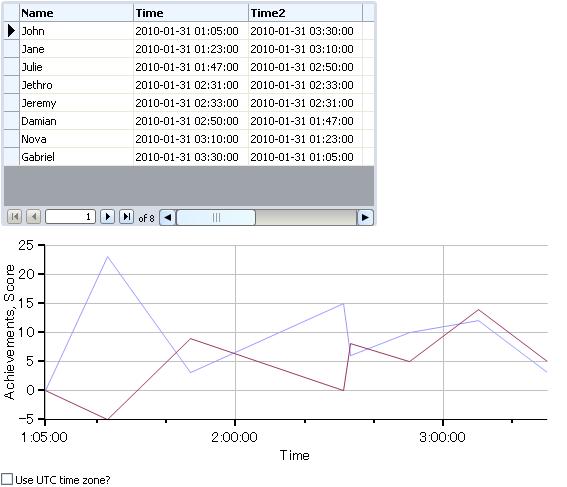
このグラフは数時間単位で値を表示しています。既定では、これらの値はローカルタイムゾーン (DateTimeZone.local) です。それを UTC に変更しどのようにデータが表示されるか確認してください。これが実際のデータを変更しないことに注意してください。この値を変えると生成されたラベルが影響を受けます。

例: Controlling the Displayed Time Zone using display-time-zone
{import * from CURL.GUI.CHARTS}
{import * from CHARTS-DOC,
    location = "../docstring-support/gui/charts-doc.scurl"
}

{def package sample-records = {get-sample-records-with-times span-of-hours? = true}}

{RecordGrid height = 6cm, record-source = sample-records}

{def package axis =
    {SimpleDateTimeAxis
        {ChartDataSeries sample-records, "Time"}
    }
}

{def package chart:LayeredChart =
    {LayeredChart
        width = 15cm,
        height = 6cm,
        bottom-axis = axis,
        {LineLayer
            sample-records,
            "Achievements",
            "Score"
        }

    }
}

{Canvas
    width = chart.width,
    height = chart.height,
    chart
}

{CheckButton
    label = "Use UTC time zone?",
    value = false,
    {on ValueChanged at cb:CheckButton do
        set axis.display-time-zone =
            {if cb.value then
                DateTimeZone.utc
             else
                DateTimeZone.local
            }
    }
}
導入: バージョン 8.0


gap-finder (ローカル オプション)
public SimpleDateTimeAxis.gap-finder:#DateTimeGapFinder =null

When non-null, this DateTimeGapFinder will be used to establish gaps in the times on this axis.

説明

Any gaps indicated by the DateTimeGapFinder will be omitted from the axis. This will not cause the removal of any data points; it simply means that all times within the specified gap will be collapsed into a single, infinitely thin area on this axis.


例: Using a DateTimeGapFinder with SimpleDateTimeAxis
{import * from CURL.GUI.CHARTS}
{import * from CHARTS-DOC,
    location = "../docstring-support/gui/charts-doc.scurl"
}

{def package x-axis =
    {SimpleDateTimeAxis
        {ChartDataSeries gap-records, "Date"}
    }
}

{let package constant highlight-group:ShapeGroup =
    {ShapeGroup
        draw-operation = DrawOperation.blend,
        color = {FillPattern.from-rgb 0.2, 0.2, 0.2, opacity = 0.5}
    }
}

{def package chart:LayeredChart =
    {LayeredChart
        width = 15cm,
        height = 6cm,
        legend-enabled? = false,
        bottom-axis = x-axis,
        {LineLayer
            {ChartDataSeries gap-records, "Value"}
        },
        {ScatterLayer scatter-shape-size = 3pt, {ChartDataSeries gap-records, "Value"}},
        {on e:PointerMotion at event-target:Visual do
            def layer = chart.layers[chart.layers.size - 1]
            def bar-width = {layer.quantize-line-thickness 1px}
            def (x, y) = {transform-coordinates e.x, e.y, event-target, layer}

            def data = layer.y-axis-data[0]
            def mapping = {layer.get-data-mapping data}
            def record = {layer.get-nearest-record-in-data x, y, data, mapping}
            {if record == null then
                {highlight-group.detach}
                {return}
            }
            def record-pos = {mapping.get-position {non-null record}, 0}

            {highlight-group.clear}
            {highlight-group.set-translation-in-parent record-pos.x, record-pos.y}
            {highlight-group.add
                {RectangleShape
                    {GRect 0.5 * bar-width, 0.5 * bar-width, 10m, 10m}
                }
            }
            {highlight-group.add
                {RectangleShape
                    {GRect 10m, 10m, 0.5 * bar-width, 0.5 * bar-width}
                }
            }
            def date = record["Date"] asa DateTime
            {highlight-group.add
                {GraphicShape
                    {VBox
                        halign = "center",
                        vorigin = "top",
                        {Fill height = 6pt},
                        {Frame
                            margin = 2pt,
                            border-width = 1px,
                            background = {FillPattern.from-rgb 1, 1, 1, opacity = 0.7},
                            color = {FillPattern.from-rgb 0.25, 0.25, 0.25},
                            {format "Date: %02d/%02d/%02d\nValue: %s",
                                date.info.year, date.info.month, date.info.day,
                                record["Value"]
                            }
                        }
                    }
                }
            }

            {layer.add highlight-group}
        }
    }
}

{RecordGrid
    height = 6cm,
    record-source = gap-records,
    {RecordGridColumn "Date"},
    {RecordGridColumn "Value", format-spec = "%.04f"}
}

{CheckButton
    label = "Use gap finder?",
    value = (x-axis.gap-finder != null),
    {on ValueChanged at cb:CheckButton do
        {if cb.value then
            set x-axis.gap-finder = {DateTimeAutoGapFinder}
         else
            set x-axis.gap-finder = null
        }
    }
}

{Canvas
    width = chart.width,
    height = chart.height,
    chart
}


gaps (フィールド)
public-get private-set SimpleDateTimeAxis.gaps:#{Array-of ChartDateTimeSpan} =null

An array containing the actual gaps elided when the current contents of the chart were generated.

説明

This field is only valid after ChartAxis.update-layout has occurred -- for instance, it will be valid when the ChartLayoutChanged event is fired.

Its value will be null if SimpleDateTimeAxis.gap-finder is not set, or if it found no gaps in the data. Otherwise, gaps will contain ChartDateTimeSpan objects representing the gaps that were found by gap-finder and elided by the chart.

Do not modify this field, or its contents. It is presented for inspection only.


例: Using the gaps field
{import * from CURL.GUI.CHARTS}
{import * from CHARTS-DOC,
    location = "../docstring-support/gui/charts-doc.scurl"
}

{RecordGrid
    height = 6cm,
    record-source = gap-records,
    {RecordGridColumn "Date"},
    {RecordGridColumn "Value", format-spec = "%.04f"}
}

{def package x-axis =
    {SimpleDateTimeAxis
        {ChartDataSeries gap-records, "Date"},
        gap-finder = {DateTimeAutoGapFinder}
    }
}

{let package constant group:ShapeGroup =
    {ShapeGroup
        draw-operation = DrawOperation.blend,
        color = {FillPattern.from-rgb 0.5, 0.5, 1.0, opacity = 0.5}
    }
}

{def package chart:LayeredChart =
    {LayeredChart
        width = 15cm,
        height = 6cm,
        legend-enabled? = false,
        bottom-axis = x-axis,
        {LineLayer {ChartDataSeries gap-records, "Value"}},
        {on e:ChartLayoutChanged do
            def layer = chart.layers[0]
            {group.clear}
            {if-non-null gaps = x-axis.gaps then
                {for gap in gaps do
                    def x = {x-axis.get-position gap.start}
                    def y0 = -chart.plot-area-bounds.height
                    def y1 = 0cm
                    {group.add
                        {PathShape
                            line-style = LineStyle.dash,
                            {Path {Distance2d x, y0}, PathOperation.line-to, {Distance2d x, y1}}
                        }
                    }
                }
            }
            {layer.add group}
        }
    }
}

{CheckButton
    label = "Use gap finder?",
    value = (x-axis.gap-finder != null),
    {on ValueChanged at cb:CheckButton do
        {if cb.value then
            set x-axis.gap-finder = {DateTimeAutoGapFinder}
         else
            set x-axis.gap-finder = null
        }
    }
}

{Canvas
    width = chart.width,
    height = chart.height,
    chart
}


minimum-space-per-major-tick (ローカル オプション)
public SimpleDateTimeAxis.minimum-space-per-major-tick:{FastArray-of Distance} =standard-desired-major-tick-space-per-span

この軸の主目盛りあたりの最小スペース (Distance の単位で) を指定します。

説明

この値はそれぞれ可能な時間単位の指定された距離の配列です。その結果、DateTimeAxisTimeSpan のそれぞれの値に(少なくとも)一つ含まれる配列でなければなりません。auto は除く。ここに与えられた配列の内容を変更することは再計算のトリガーとならないことに注意してください。必要に応じて Chart.invalidate-layout を使用して下さい。あるいは、配列の内容を変えず、代わりにこのオプションに新しい配列を割り当てて下さい。
この軸は必要に応じて、目盛りをスキップすることで指定された Distance にあわせようとします。


minimum-space-per-minor-tick (ローカル オプション)
public SimpleDateTimeAxis.minimum-space-per-minor-tick:Distance =0.35cm

この軸の副目盛りあたりの最小スペース (Distance の単位で) を指定します。

説明

この軸は必要に応じて目盛りをスキップすることで Distance を指定しようとします。


round-extents-to-tick-span? (ローカル オプション)
public SimpleDateTimeAxis.round-extents-to-tick-span?:bool =false

この軸を拡張して、(SimpleDateTimeAxis.tick-span に従って)採用されている時間単位の倍数に最も近い倍数に丸められるかを指定します。

説明

この値が false の場合、(最小値、最大値が軸に表示される)範囲は直接グラフデータの最小、最大値に対応します。そうでない場合、それらは目盛り単位の倍数になるように広げられます。

以下の例では、実際の日付の値が、2010年1月中旬から2010年4月上旬になっています。round-extents-to-tick-span?allowed-distance-to-first-tick の間で交差しているのを見ることが出来ます。(allowed-distance-to-first-tick を 4 に設定してみてください。)

例: Using round-extents-to-tick-span? and allowed-distance-to-first-tick
{import * from CURL.GUI.CHARTS}
{import * from CHARTS-DOC,
    location = "../docstring-support/gui/charts-doc.scurl"
}

{def package sample-records = {get-sample-records-with-times}}

{RecordGrid height = 6cm, record-source = sample-records}

{def package axis =
    {SimpleDateTimeAxis
        {ChartDataSeries sample-records, "Time"}
    }
}


{def package chart:LayeredChart =
    {LayeredChart
        width = 15cm,
        height = 6cm,
        bottom-axis = axis,
        {LineLayer
            sample-records,
            "Achievements",
            "Score"
        }

    }
}

{Canvas
    width = chart.width,
    height = chart.height,
    chart
}

{CheckButton
    label = "round-extents-to-tick-span?",
    value = axis.round-extents-to-tick-span?,
    {on ValueChanged at cb:CheckButton do
        set axis.round-extents-to-tick-span? = cb.value
    }
}


allowed-distance-to-first-tick (cm):
{TextField
    value = "" & axis.allowed-distance-to-first-tick / 1cm,
    {on ValueFinished at tf:TextField do
        set axis.allowed-distance-to-first-tick =
            {tf.value.to-double} * 1cm
    }
}
導入: バージョン 8.0


start-of-week (ローカル オプション)
public SimpleDateTimeAxis.start-of-week:int =1

週に対応する日付の目盛りを決定するために、週の始まりを指定します。

説明

デフォルト値は 1 で、月曜日に対応します。正当な値は 1 から 7 の間です。(これは DateTimeInfo.day-of-week と同じ範囲となっています。)

このサンプルでは、目盛り単位が月になっており、その結果副目盛りが週になっています。それは、週の始まりに対応する日付を配置することを意味しています。どの曜日が週の始まりであるかを変えるときの主目盛りの変化を確認してください。

例: Using start-of-week
{import * from CURL.GUI.CHARTS}
{import * from CHARTS-DOC,
    location = "../docstring-support/gui/charts-doc.scurl"
}

{def package sample-records = {get-sample-records-with-times}}

{RecordGrid height = 6cm, record-source = sample-records}

{def package axis =
    {SimpleDateTimeAxis
        {ChartDataSeries sample-records, "Time"},
        tick-span = DateTimeAxisTimeSpan.month
    }
}

{def package chart:LayeredChart =
    {LayeredChart
        width = 15cm,
        height = 6cm,
        bottom-axis = axis,
        {LineLayer
            sample-records,
            "Achievements",
            "Score"
        }

    }
}

{Canvas
    width = chart.width,
    height = chart.height,
    chart
}

start-of-week:
{TextField
    value = "" & axis.start-of-week,
    {on ValueFinished at tf:TextField do
        set axis.start-of-week =
            {tf.value.to-int}
    }
}
導入: バージョン 8.0


tick-span (ローカル オプション)
public SimpleDateTimeAxis.tick-span:DateTimeAxisTimeSpan =DateTimeAxisTimeSpan.auto

この軸の目盛りを生成するために使用する時間単位を指定します。

説明

この値は各主目盛が表す単位について記述します。すなわち、各目盛りは一般的に、これらの時間単位の整数に丸められた値を表します。また、表示された軸の範囲に影響を及ぼすかもしれません。SimpleDateTimeAxis.round-extents-to-tick-span? を参照して下さい。
既定値は DateTimeAxisTimeSpan.auto であり、データで指定された範囲に基づいて計算された結果となります。これは通常望まれた挙動です。グラフのレイアウトが起こると、SimpleDateTimeAxis.actual-tick-span から実際の結果として発生する値を確認することが出来ます。

注意事項

手動でこの値を設定すると非常に望ましくない結果となる場合があります。例えば、数週間のデータの場合、目盛り単位を分単位で設定することは極端に多くの数の目盛りが生成される結果となります。これは重大なパフォーマンスの問題となります。
また、通常、大きな値を使用することはローカルタイムゾーンの中で表現できる範囲が限られているのでエラーが発生する場合があります。UTC タイムゾーンに基づいたデータを使用することや SimpleDateTimeAxis.display-time-zoneDateTimeZone.utc に設定することでこれらの問題を回避することができます。10年間より大きな単位がこの問題を避けるために、以下の例で提供されないことに注意してください。設定を変更して、それが示されることを確認してください。


例: Using SimpleDateTimeAxis.tick-span
{import * from CURL.GUI.CHARTS}
{import * from CHARTS-DOC,
    location = "../docstring-support/gui/charts-doc.scurl"
}

{def package sample-records = {get-sample-records-with-times span-of-hours? = true}}

{RecordGrid height = 6cm, record-source = sample-records}

{def package tick-span-frame = {Frame}}

{def package axis =
    {SimpleDateTimeAxis
        {ChartDataSeries sample-records, "Time"}
    }
}


{def package chart:LayeredChart =
    {LayeredChart
        width = 15cm,
        height = 6cm,
        bottom-axis = axis,
        {LineLayer
            sample-records,
            "Achievements",
            "Score"
        },
        {on e:ChartLayoutChanged do
            {tick-span-frame.add replace? = true, {format "%s", axis.actual-tick-span}}
        }

    }
}

{Canvas
    width = chart.width,
    height = chart.height,
    chart
}

{GroupBox label = "Actual tick span in use:",
    tick-span-frame
}

{GroupBox label = "tick-span:",
    {RadioFrame
        {spaced-vbox
        {RadioButton radio-value = DateTimeAxisTimeSpan.minute},
        {RadioButton radio-value = DateTimeAxisTimeSpan.hour},
        {RadioButton radio-value = DateTimeAxisTimeSpan.day},
        {RadioButton radio-value = DateTimeAxisTimeSpan.week},
        {RadioButton radio-value = DateTimeAxisTimeSpan.month},
        {RadioButton radio-value = DateTimeAxisTimeSpan.year},
        {RadioButton radio-value = DateTimeAxisTimeSpan.decade},
        {RadioButton radio-value = DateTimeAxisTimeSpan.auto, value = true}
        },
        {on ValueFinished at rf:RadioFrame do
            set axis.tick-span = rf.value asa DateTimeAxisTimeSpan
        }
    }
}

{CheckButton
    label = "round-extents-to-tick-span?",
    value = axis.round-extents-to-tick-span?,
    {on ValueChanged at cb:CheckButton do
        set axis.round-extents-to-tick-span? = cb.value
    }
}
導入: バージョン 8.0


メソッド詳細
generate-major-tick (メソッド)
public {SimpleDateTimeAxis.generate-major-tick
value:any,
tick-index:int,
position:Distance = {self.get-position value}
}:Shape

主目盛りを表す Shape を生成します。

value: この目盛りを表わすデータ値。これは、ChartAxis.get-position に渡され、ChartTick.value として使用される場合があります。
tick-index: この目盛りのゼロ ベースのインデックス。これは、色が交互に変わる目盛りの色の変更などの機能に役立ちます。
position: 目盛りが配置される軸に沿った位置。既定では、ChartAxis.get-position は、正しい位置を取得するために value を使用して呼び出されます。既に値を計算している場合は、position を使用してその値を渡すだけです。これは単なる最適化です。

戻り値

目盛りを表す Shape

説明

このメソッドは、一般的に、必要な目盛りを作成するために、ChartAxis.generate-major-ticks の実装によって呼び出されます。
このメソッドは、major-tick-factory があった場合にその値を呼び出すために実装されます。なければ MajorTickShape が作成されます。ソースに関係なく、結果の ShapeChartAxis.major-tick-group に追加され、返されます。

注意事項

ChartAxis をサブクラス化しない限り、major-tick-factory を設定することは、主目盛りの外観を制御するために推奨される手法です。


generate-major-ticks (メソッド)
protected {SimpleDateTimeAxis.generate-major-ticks}:void

この軸に沿った主目盛りを表すのに必要なすべての Shape を生成します。

説明

これは、ChartAxis の実装で、生成する目盛りの数、目盛りを配置する場所、およびその方法を明らかにして、実際に実行するメソッドです。このメソッドは、ChartAxis.update-layout から呼び出されることを想定しています。
このメソッドを実装する場合は、ChartAxis.generate-major-tick を使用して、標準の目盛り形状を作成すると便利です。生成された Shape は、ChartAxis.major-tick-group に追加されます。


generate-minor-tick (メソッド)
public {SimpleDateTimeAxis.generate-minor-tick
value:any,
tick-index:int,
position:Distance = {self.get-position value}
}:Shape

補助目盛りを表す Shape を生成します。

value: この目盛りを表わすデータ値。これは、ChartAxis.get-position に渡され、ChartTick.value として使用される場合があります。
tick-index: この目盛りのゼロ ベースのインデックス。これは、色が交互に変わる目盛りの色の変更などの機能に役立ちます。
position: 目盛りが配置される軸に沿った位置。既定では、ChartAxis.get-position は、正しい位置を取得するために value を使用して呼び出されます。既に値を計算している場合は、position を使用してその値を渡すだけです。これは単なる最適化です。

戻り値

目盛りを表す Shape

説明

このメソッドは、必要な目盛りを作成するために、ChartAxis.generate-minor-ticks の実装によって呼び出すことができます。
このメソッドは、minor-tick-factory があった場合にその値を呼び出すために実装されます。なければ MinorTickShape が作成されます。ソースに関係なく、結果の ShapeChartAxis.minor-tick-group に追加され、返されます。

注意事項

ChartAxis をサブクラス化しない限り、minor-tick-factory を設定することは、補助目盛りの外観を制御するために推奨される手法です。
既定では、補助目盛りは作成されません。補助目盛りを作成するには、ChartAxis の独自のサブクラスまたはその実装の 1 つを作成し、ChartAxis.generate-minor-ticks をオーバーライドする必要があります。


generate-minor-ticks (メソッド)
protected {SimpleDateTimeAxis.generate-minor-ticks}:void

この軸に沿った補助目盛りを表すのに必要なすべての Shape を生成します。

説明

これは、ChartAxis.generate-major-ticks に対応する補助目盛りです。標準軸を実装しても補助目盛りは生成されないので、ChartAxis.generate-minor-ticks は何も実行しません。このメソッドは、ChartAxis.update-layout から呼び出されることを想定しています。
このメソッドを実装しようとする場合は、ChartAxis.generate-minor-tick を使用して、標準の目盛り形状を作成すると便利です。生成された Shape は、ChartAxis.minor-tick-group に追加されます。


generate-tick-label (メソッド)
public {SimpleDateTimeAxis.generate-tick-label
tick:ChartTick,
tick-rotation:Angle
}:#Shape

指定の目盛りの目盛りラベルを生成します。

tick: ラベルが作成される ChartTick
tick-rotation: 目盛りを配置する Angle。これは通常、tick-label-rotation で制御します。

戻り値

ラベルを表す Shape、または null (この値では目盛りラベルを表示しない場合)。

説明

既存の ChartAxis クラスをサブクラス化しようとする場合、このメソッドをオーバーライドできます。目盛りラベルの外観の制御については、ChartAxis.get-tick-label を参照してください。
作成される Shape は位置決めの必要がありません。ChartLabelGroup が、適宜その位置を軸の位置に合わせて直接に設定するためです。(回転とスケールは影響を受けません。)この位置に関するオフセットを指定したい場合、ラベル形状に必要な変換を適用して、それを ShapeGroup 内に組み込むことができます。ShapeGroup は、ChartLabelGroup で位置付けられるオブジェクトになり、組み込んだ子 Shape は、これと共に配置されます。軸ラベルのスケーリングを使用する同様の手法を示す例については、axis-label を参照してください。
生成されたオブジェクトがその原点に対して適切に位置付けられることに注意する必要があります。原点は、目盛りが示す方向の axis-label-group-spacing で示されたオフセットの目盛りに位置付けられるように配置されます。生成した形状が意図した位置になるように (たとえば、軸および目盛りが重ならないように)、注意して位置付ける必要があります。
TextShape などのオブジェクトに関する halignhoriginなどのオプションを使用して、このことを確実にする方法については、tick-label-factory を参照してください。

注意事項

これは通常、単に TextShape 内の ChartTick.value を表示するために実装されます。DataSeriesAxis は、Domain.format を使用して、適切な String 表現が使用されるようにするために、このメソッドをオーバーライドします。


get-display-zone (メソッド)
public {SimpleDateTimeAxis.get-display-zone}:DateTimeZone

この軸に沿って値を表示するために使用される DateTimeZone を取得します。

戻り値

SimpleDateTimeAxis.display-time-zone が non-null である場合、このメソッドは単純にその値を返します。そうでなければ、それは入力データのタイムゾーンを返します。(レイアウトが発生した後に、例えば、ChartLayoutChanged が発生した後に、これは正確になるでしょう。)
導入: バージョン 8.0


get-position-at-zero (メソッド)
public {SimpleDateTimeAxis.get-position-at-zero}:Distance

この軸に沿ったゼロに対応する空間位置を取得します。

説明

これにより、値は ChartAxis.get-position と同じ動作を持つこの軸の長さと共に返されます。詳細については、該当のメソッドを参照してください。

注意事項

ゼロの概念は、すべての軸で意味を持つわけではありません。具体的には、GenericDataSeriesAxis および EnumeratedBarChartAxis は序数軸であって、連続値ベースの軸でないので、ゼロの概念は適用しません。こうした軸では常に 0m が返されます。


get-relative-position (メソッド)
public {SimpleDateTimeAxis.get-relative-position val:any}:Fraction

データ値に対応する空間位置を計算します。

value: 軸の種類によって、必要な型が異なる値。ChartAxis.get-position を参照してください。互換性のない型を渡すとエラーが発生します。

戻り値

軸に沿ったデータ値の位置を示す Fraction。軸の原点の 0 から、軸の終点の 1 までです。

説明

これは基本的に、軸の方向または長さの概念がない ChartAxis.get-position と同じです。実際、このメソッドはこの意味で実装されます。詳細については、ChartAxis.get-position を参照してください。


get-value-relative (メソッド)
public {SimpleDateTimeAxis.get-value-relative
position-frac:Fraction
}:any

この軸に沿った位置に対応するデータ値を計算します。

position: この軸に沿った位置 (分数として)。これは、01 の間にある必要があります。

戻り値

この軸に適切な型の値。各種の軸に適切な値の Type については、ChartAxis.get-position を参照してください。

説明

これは基本的に、軸の方向または長さの概念がない ChartAxis.get-value と同じです。実際、このメソッドはこの意味で実装されます。詳細については、ChartAxis.get-value を参照してください。


normalize-value (メソッド)
public {SimpleDateTimeAxis.normalize-value val:DateTime}:DateTime

適切な DateTimeZone に変換することによって DateTime 値を標準化します。

val: 変換される値。

戻り値

適切なタイムゾーンの DateTime。この値は val と同じオブジェクトとなりますが、val は修正されません。タイムゾーンの変換が必要な場合、返されるオブジェクトは新しい DateTime オブジェクトとなります。

説明

SimpleDateTimeAxis.display-time-zone が non-null である場合、normalize-valuedisplay-time-zone のタイムゾーンの DateTime を返します。そうでない場合は、入力されたデータからタイムゾーンが決定されます。入力データが複数のタイムゾーンを含んでいる場合、これは予期しない結果となるかもしれません。よって、そのようなケースには display-time-zone を使用することを強く推奨します。

オーバーライド

データを他に標準化したり変換する場合は、このメソッドをオーバーライドしてください。しかし、その手順が複雑である場合は、図にする前にデータを加工することが効果的になるかもしれません。
オーバーライドが一貫したタイムゾーンを保証しない場合、この実装を通して呼び出すことが推奨されます。
導入: バージョン 8.0


update-layout (メソッド)
public {SimpleDateTimeAxis.update-layout length:Distance}:void

軸に必要なすべてのレイアウト操作を実行します。

length: 軸の長さ。ChartAxis.length はこの値に設定されます。

説明

ChartAxis.update-layout は、この軸に関連して生成されたすべての Shape を再生成します。これを行うには、ChartAxis.clear-shapes および ChartAxis.regenerate-shapes が呼び出されます。
このメソッドは、グラフ レイアウト処理中に LayeredChart.update-layout によって呼び出されます。これを直接呼び出す必要は、あまりありません。ただし、軸でレイアウト処理を実行する直前または直後に操作を実行するために、サブクラスでこのメソッドをオーバーライドすると便利な場合があります。